
Visly: AI Infographic Generator for LinkedIn
Visly is an AI infographic generator built for LinkedIn creators.
Turn a LinkedIn post, a rough idea, or a single sentence into a polished, on-brand infographic in seconds.
You don't need to have any design skills, or complicated prompts at hand, or have to spend an hour fighting with templates.
What is Visly?
Visly is an AI-powered infographic generator designed specifically for people who create content on LinkedIn.
You give Visly your post content or idea, and Visly turns it into a visual.
You can set your brand colors, footer, logo, and fonts once, so your graphics stay consistent instead of looking like a different designer made every post.
The goal is simple: Make it dramatically easier to turn good LinkedIn content into good LinkedIn visuals.
You can paste:
- ■A LinkedIn post
- ■Raw text
- ■An idea
- ■A one-line prompt
Visly understands the content and generates an infographic around it.
The current Visly workflow is designed around a one-prompt generation process, with outputs intended to be ready in under 30 seconds.
Visly is built for
- ■LinkedIn creators
- ■Founders
- ■Ghostwriters
- ■Personal brands
- ■Coaches and consultants
- ■B2B marketers
- ■Content teams
- ■Social media managers
- ■Agencies creating content for multiple clients
Why did we create Visly?
Creating the actual LinkedIn post is only half the work. The other half is making people stop scrolling long enough to read it.
And that's where things usually get annoying.
You open Canva. Find a template. Change the colors. Replace the fonts. Resize the text. Move an icon. Realize the spacing looks weird. Change the layout. Export it. Then notice something is still slightly off.
And that's how you lose an hour without even realizing.
The alternative is asking an AI image generator, such as ChatGPT, Gemini, or NotebookLLM to make the infographic for you.
That sounds faster… until you spend ten prompts trying to get the text right, fixing the layout, and explaining your brand colors again.
Or you send the brief to a designer, and now you have to pay them and wait for a full day or two to get the design back from them.
Visly was built to remove that entire middle layer. Your personal brand should be easy to build, not be complicated and a 10-step process. If you want to build a brand for yourself on your own without the help of any third-party, this is definitely for you.
Give it the content. Get the visual.
How Visly Works
Visly keeps the process deliberately simple.
1. Give Visly your post content or topic
Paste your LinkedIn post, raw content, or just the topic of your post. You don't need to write a giant prompt describing every element of the design.
Visly DOES NOT work on prompts. It only takes your topic or content. The rest of the design process is handled entirely by Visly's design engine.
A simple instruction is enough to get started.
2. Choose your design category
Visly has a total of 8 design categories you can choose from:
- ■Checklist
- ■Flowchart
- ■Comparison
- ■Visual Grid
- ■Mindmap
- ■Anatomy
- ■Step-by-step
- ■Matrix
Select the type of category that goes best with your post type.
3. Choose your design style
Visly has a total of 5 styles you can choose from for every category:
- ■Bold (contrasting colors, bold look that pops)
- ■Magazine (looks like it came out of a magazine print, glossy and professional)
- ■Pastel (muted, pastel tones that look calming and minimalistic)
- ■Handwritten (text is handwritten to give a more realistic feel as if written by hand)
- ■Retro (feels like it came straight from the 90's magazine)
Choose the one you love the most and thinks can go best with your current post type.
4. Choose your brand colors
Pick your 3 main colors that you regularly use for your visuals and your branding. Upload your logo or profile picture and add your footer text once.
Name it and now Visly has saved it. You can always use this for every infographic you create.
You can save multiple brand palettes if you're on the Creator plan. This is best for ghostwriters and marketing teams who're handling multiple clients' visual assets at once.
5. Enter your topic
Enter your topic or post content into the box and pick a tone. We have 5 tones:
- ■Conversational (when you want the content to feel warm and friendly)
- ■Professional (when you want the text to be corporate and formal)
- ■Humorous (when you want the content to be sarcastic and funny, meant to roast something/someone)
- ■Value-driven (when you're focused on providing value to the reader and don't want to waste space on unnecessary stuff)
6. Visly generates the infographic
Hit "Generate Infographic" and the AI turns your content into a visual designed for LinkedIn.
The aim isn't to make a generic "AI image." It's to turn information into something people can actually scan while scrolling.
(Note: it can take 20-30 seconds to generate. Sometimes a complicated infographic can take longer so wait for it. Try to stay on the same tab and window while generating. If you move to a different tab and come back to see no infographic or output, go to the dashboard, you will find it there)
7. Download and publish
Once your infographic is ready, export it and use it with your LinkedIn post.
That's the workflow: Content → Visly → Infographic → LinkedIn
What Can You Create With Visly?
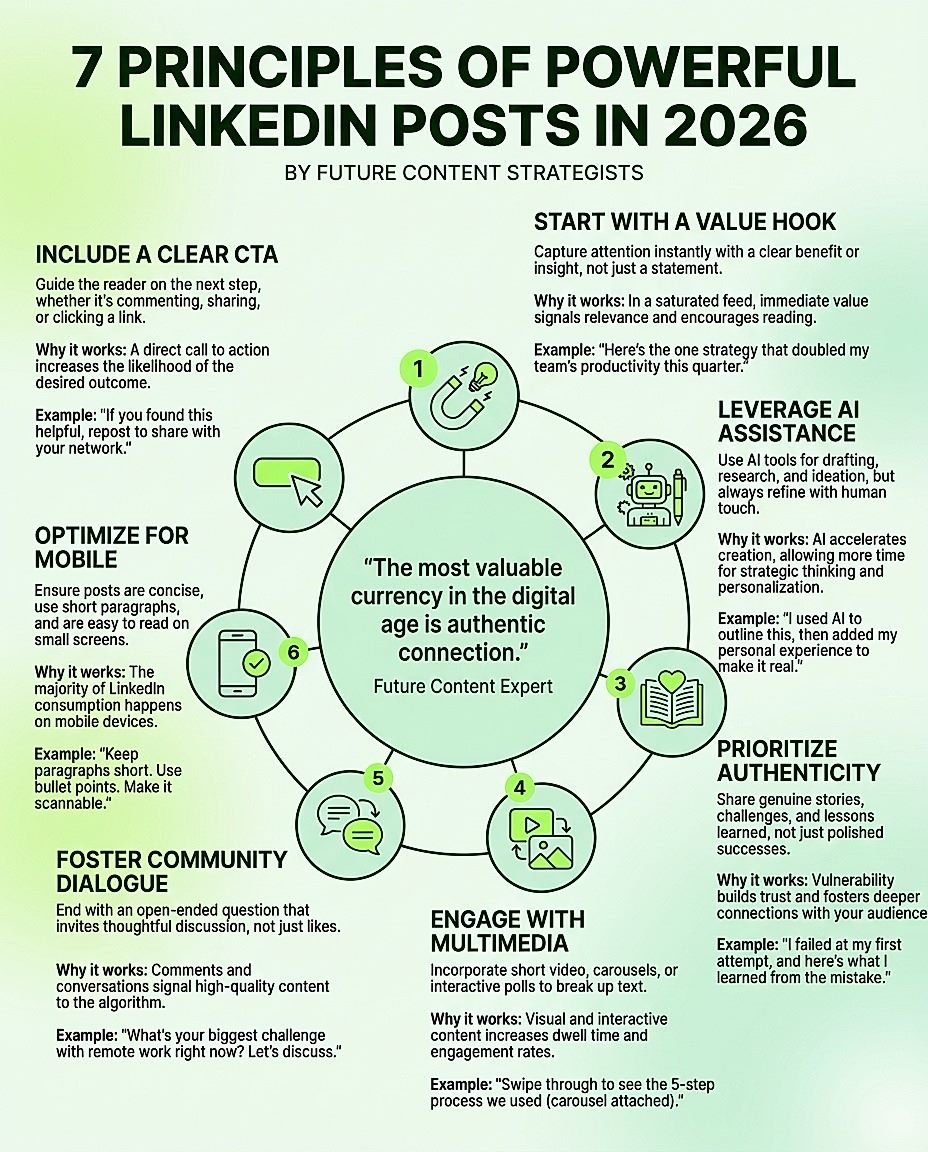
Visly is designed around the types of visuals that work particularly well for professional content.
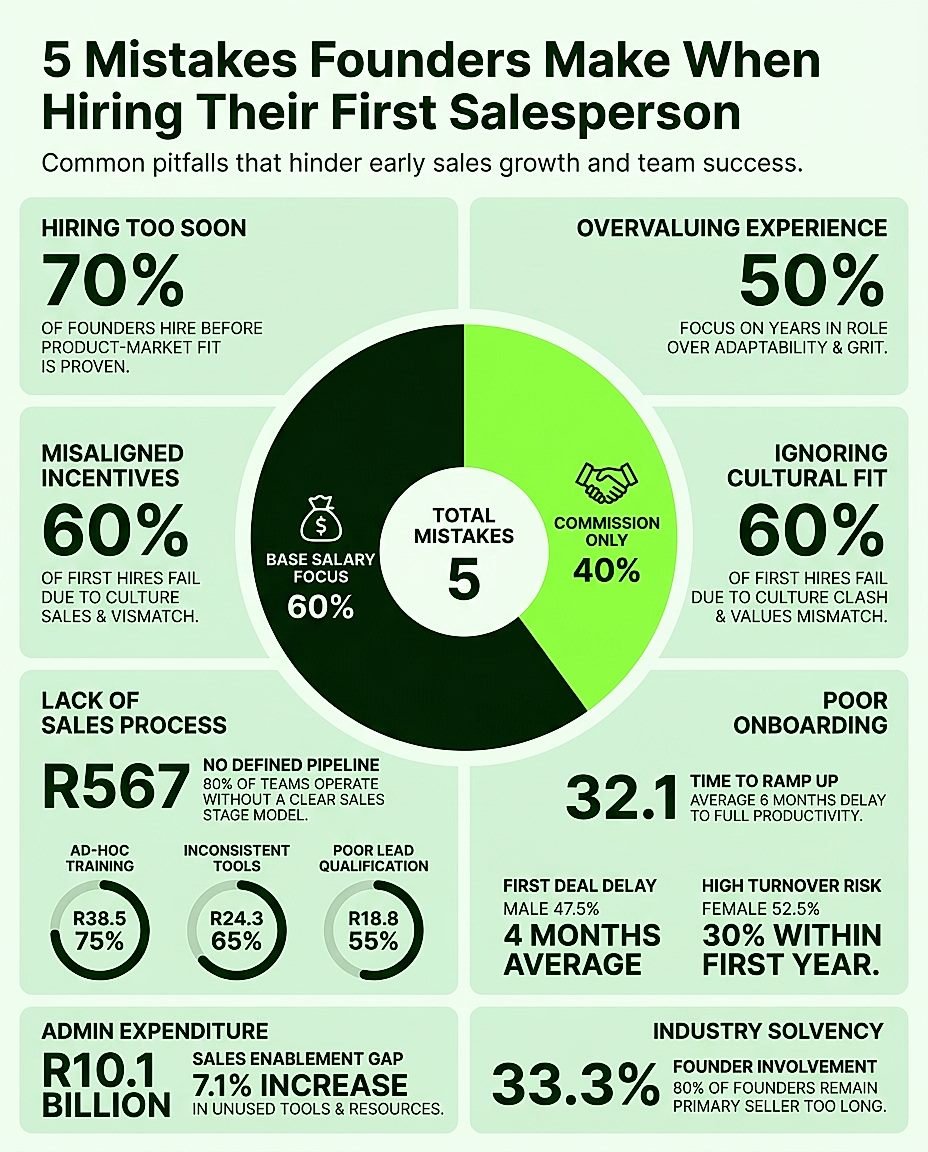
Educational infographics
Turn a complex idea into a visual breakdown.
For example: "5 mistakes founders make when hiring their first salesperson." Instead of putting all five points into a wall of text, Visly can turn the idea into a visual people can scan quickly.
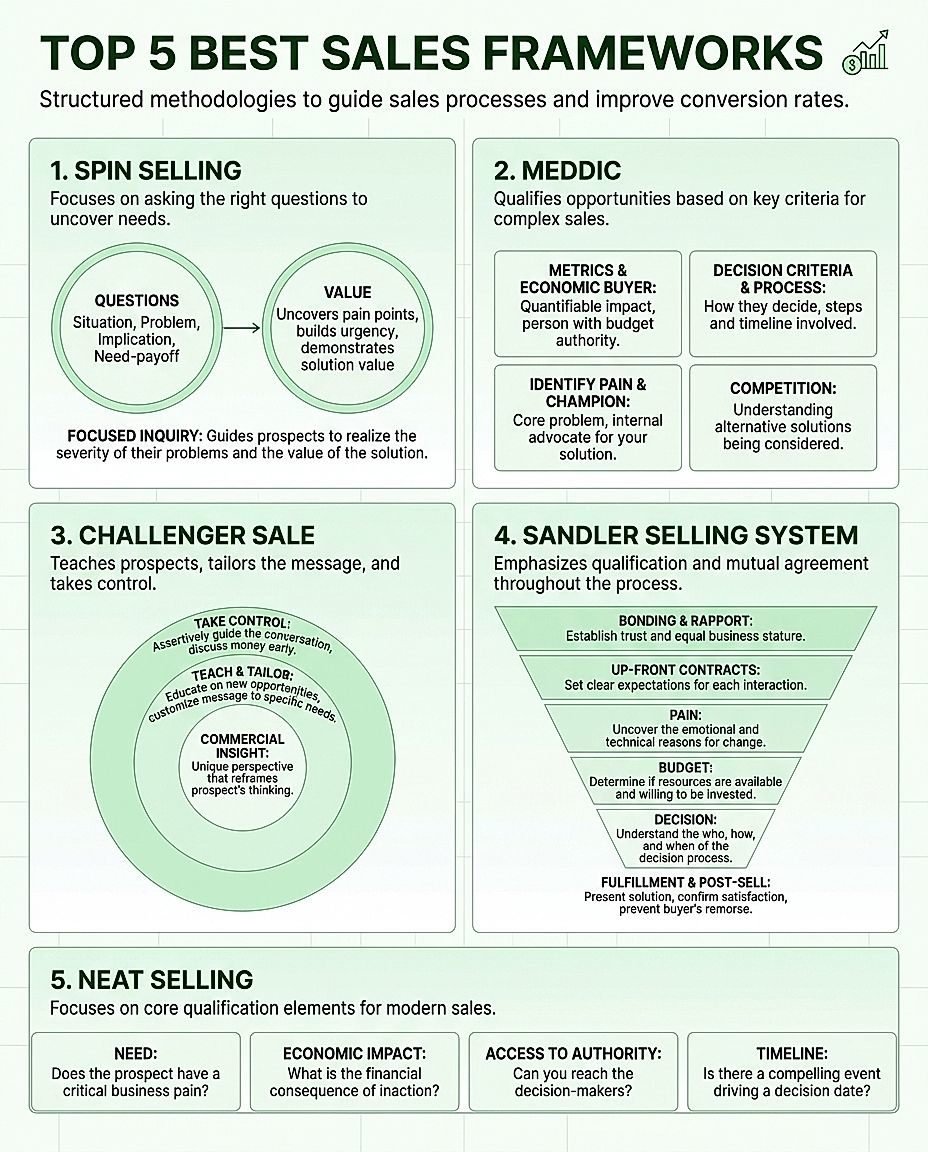
Frameworks
Have a framework you regularly teach? Turn it into a visual.
- ■Sales frameworks
- ■Marketing frameworks
- ■Leadership frameworks
- ■AI frameworks
- ■Productivity systems
- ■Content frameworks
Frameworks are particularly useful as visuals because the reader can understand the structure before reading every detail.
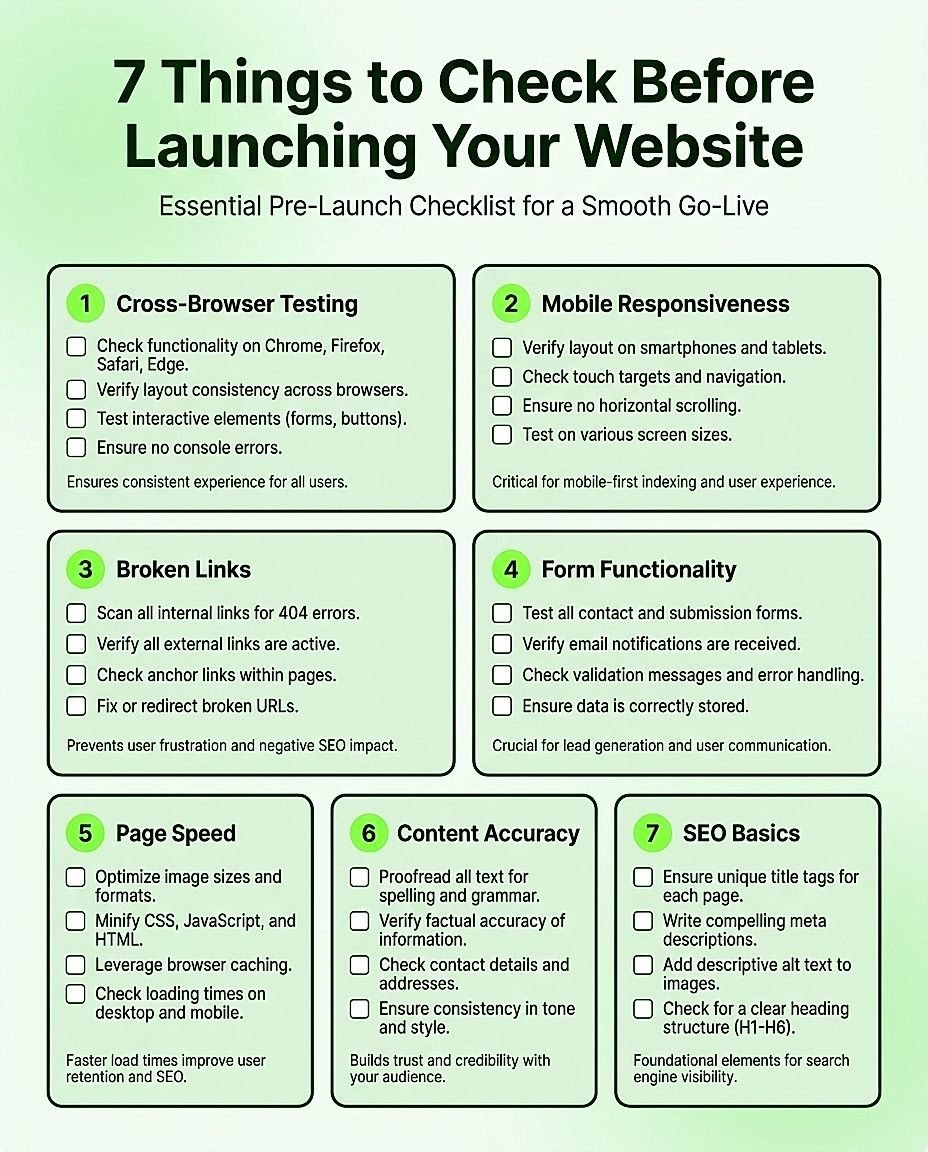
Lists and checklists
Turn "7 things to check before launching your website" into a visual checklist.
This makes the content easier to save, share and reference later.
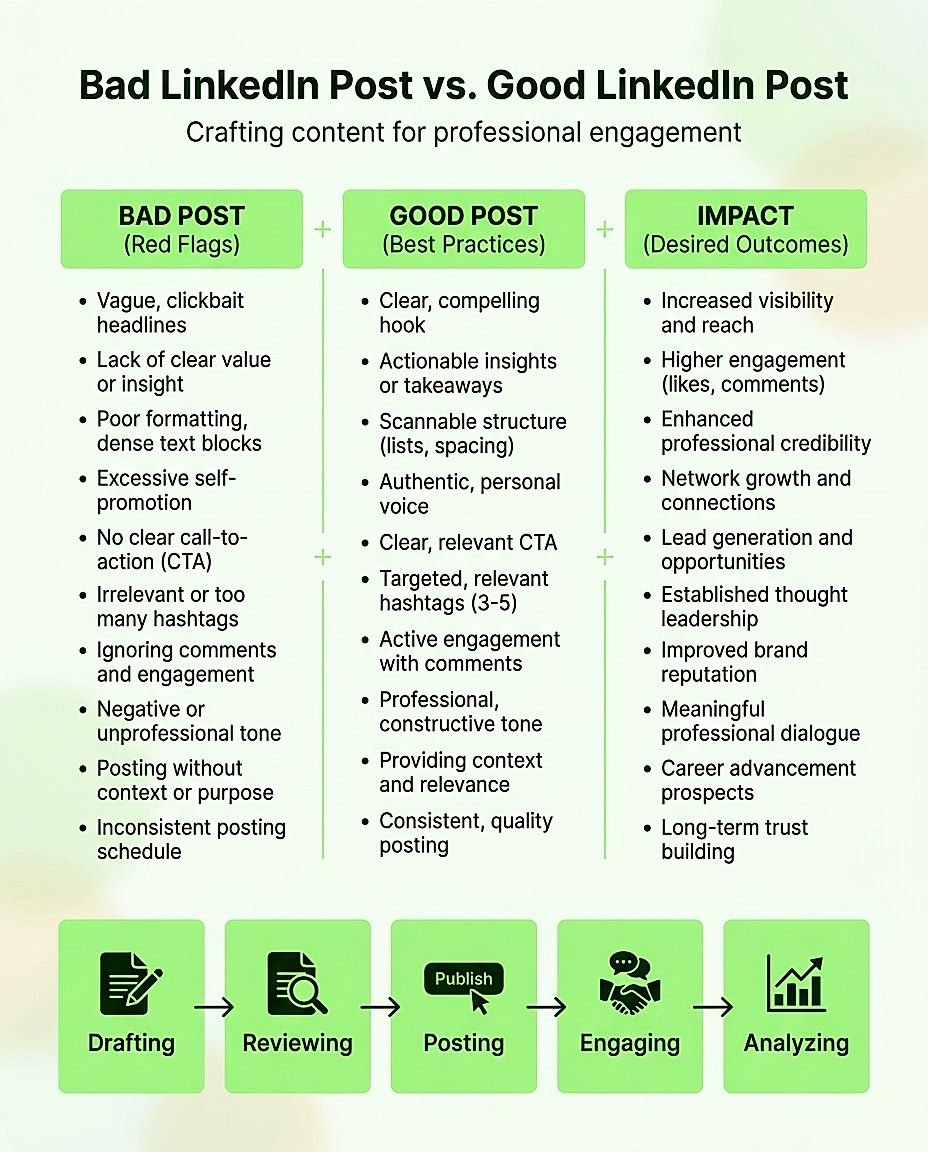
Comparisons
Comparisons are naturally visual.
- ■Bad LinkedIn post vs. Good LinkedIn post
- ■Manual process vs. Automated process
- ■Old workflow vs. New workflow
- ■Before AI vs. After AI
A visual comparison can communicate the difference much faster than several paragraphs.
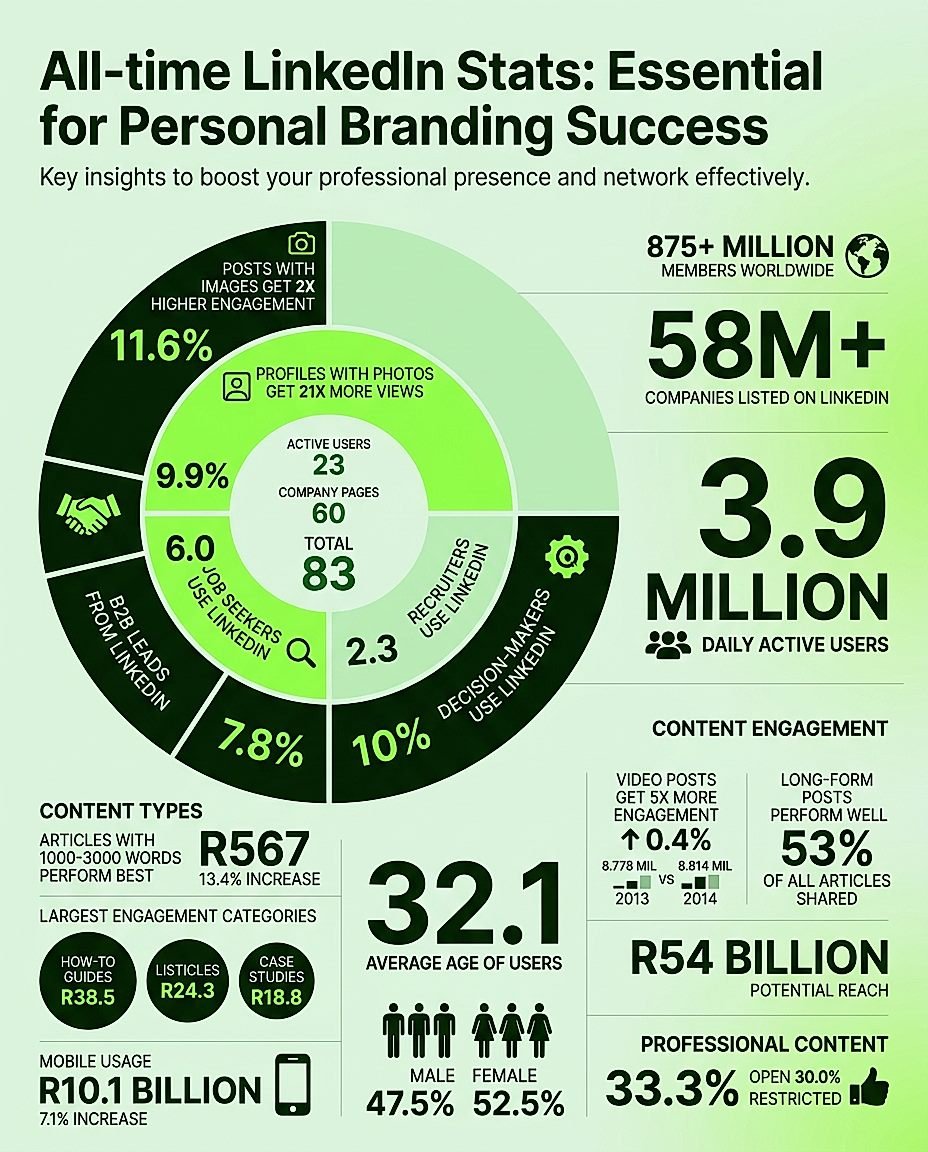
Data and statistics
Have an important statistic? Give it visual weight.
Instead of: "Companies that post consistently generate more opportunities." Create a graphic that puts the actual number, context and takeaway front and center.
If you're using statistics, always provide the underlying source and context. Visly can help present the information visually, but it shouldn't replace fact-checking.
Step-by-step processes
Some ideas are easier to understand when they're shown as a sequence.
- ■Idea → Research → Draft → Edit → Publish
- ■Lead → Discovery → Proposal → Close → Onboarding
A process infographic lets readers understand the journey at a glance.
Visly vs. Canva
Canva is a powerful general-purpose design platform. It gives you templates, design tools and a huge amount of creative control.
But that also means you have to do much of the design work yourself. Visly takes a different approach.
| Visly | Canva | |
|---|---|---|
| Built specifically for LinkedIn content | ✓ | — |
| Generate from one prompt | ✓ | — |
| Brand colors saved | ✓ | ✓ |
| Brand fonts saved | ✓ | ✓ |
| Designed around infographic creation | ✓ | — |
| Requires manual template editing | Minimal | Often required |
| Designed for non-designers | ✓ | ✓ |
This doesn't mean Canva is bad. It means the products solve different problems.
Canva gives you a design canvas. Visly gives you a faster path from content to infographic.
If you enjoy designing every element yourself, Canva gives you more control. If your problem is: "I already know what I want to say. I just need a good visual." Visly is built for that problem.
Visly vs. ChatGPT and AI Image Generators
You can ask ChatGPT or another AI model to create an infographic. The problem is that generating an image isn't the same thing as creating a usable infographic.
You may have to deal with:
- ■Incorrect text
- ■Inconsistent layouts
- ■Wrong brand colors
- ■Poor hierarchy
- ■Repeated prompting
- ■Unpredictable formatting
- ■Multiple revisions
Visly is designed around the specific job of turning content into a structured visual. Instead of spending your time explaining what the infographic should look like, you start with the content.
Your idea is the input. The infographic is the output.
Visly for LinkedIn Ghostwriters
If you ghostwrite LinkedIn content for clients, Visly becomes even more useful. You're not managing one brand. You're managing several.
And every client has different:
- ■Brand colors
- ■Fonts
- ■Visual styles
- ■Audiences
- ■Topics
- ■Content formats
Recreating those specifications every time you make a graphic is tedious. Visly lets you keep each client's visual identity consistent so you can focus on the content.
Instead of: Write post → brief designer → wait → revise → approve → publish. You can move toward: Write post → generate visual → review → publish.
That can make a meaningful difference when you're producing content at scale.
Visly for Founders and Personal Brands
You don't need to become a designer to build a recognizable visual identity.
A founder might have dozens of useful ideas sitting inside:
- ■LinkedIn posts
- ■Podcasts
- ■Sales calls
- ■Newsletters
- ■Customer conversations
- ■Presentations
- ■Internal documents
The challenge is turning those ideas into content people actually notice.
Visly gives founders a faster way to turn their expertise into visual content without adding another design project to their week.
Visly for Content Teams and Agencies
Content teams have a different problem. They need consistency and speed.
A team might produce dozens of social posts every month. If every graphic requires a separate design request, the visual production process quickly becomes a bottleneck.
Visly can help reduce that bottleneck by giving the content team a faster way to create graphics from the content they're already producing.
The result: More visual content without turning every visual into a design project.
What Makes Visly Different?
There are plenty of tools that can generate images. There are plenty of tools that provide templates. There are plenty of AI tools that can follow prompts.
Visly sits somewhere more specific: Content → visual communication.
The product is designed around the assumption that you already have something worth saying. You don't need another tool to invent your idea. You need a tool that can help you present the idea well.
That's the problem Visly is trying to solve.
Create On-Brand Infographics Without Starting From Scratch
One of the biggest problems with AI-generated visuals is consistency. You might generate something that looks great today. Then tomorrow you generate another graphic and it looks completely different.
- ■Different colors.
- ■Different typography.
- ■Different layout.
- ■Different visual personality.
That makes it difficult to build a recognizable personal brand.
Visly lets you establish your visual identity so your graphics can stay consistent across your content. Your audience shouldn't have to read your name to recognize your content.
The visual identity should do some of that work for you.
How Long Does It Take to Create an Infographic With Visly?
Visly is designed to generate an infographic in under 60 seconds. Compare that with the traditional workflow:
- ■Find template
- ■Edit layout
- ■Change colors
- ■Change fonts
- ■Paste content
- ■Fix spacing
- ■Resize everything
- ■Export
The exact time depends on how complicated the design is and how much customization you want.
But the core idea behind Visly is simple: The content should take longer than the visual.
Do You Need Design Experience to Use Visly?
No.
Visly is designed for people who care about how their content looks but don't necessarily want to become professional designers.
You don't need to know:
- ■Typography theory
- ■Grid systems
- ■Layout design
- ■Color theory
- ■Visual hierarchy
- ■Figma
- ■Photoshop
You need: An idea worth turning into a visual.
Visly handles much of the design process for you.
Is Visly Free?
Visly currently offers a free trial that lets new users create up to 2 infographics without a credit card.
That means you can test the workflow before deciding whether it fits your content process.
The Starter plan is extremely affordable: you get to create 45 infographics in just $7 a month.
The Creator plan offers 100 infographics with up to 5 brand palettes you can save, just for $15.
Who Should Use Visly?
Visly is a good fit if you:
- ■Publish regularly on LinkedIn
- ■Want more visual content
- ■Don't have time to design every post
- ■Don't want to learn complex design software
- ■Want your graphics to follow your brand
- ■Create content for multiple clients
- ■Run a personal brand
- ■Write LinkedIn content professionally
- ■Want to turn frameworks and ideas into visuals
Visly may not be the right tool if you want complete pixel-level control over every element of a design.
That's where a traditional design tool can make more sense.
Visly is optimized for a different priority: Speed + consistency + content-first creation.